Use Cases for Kubecost
Overview
Kubecost has 3 primary use cases:
- Gain visibility into what is consuming Kubernetes resources - and driving the costs.
- Understand if those resources are being used efficiently and view optimization options.
- FinOps use cases such as cost savings, chargeback and showback.
Kubecost is an API first solution - meaning that everything available in the UI is also available via API.
This portion of the lab will focus on the UI.
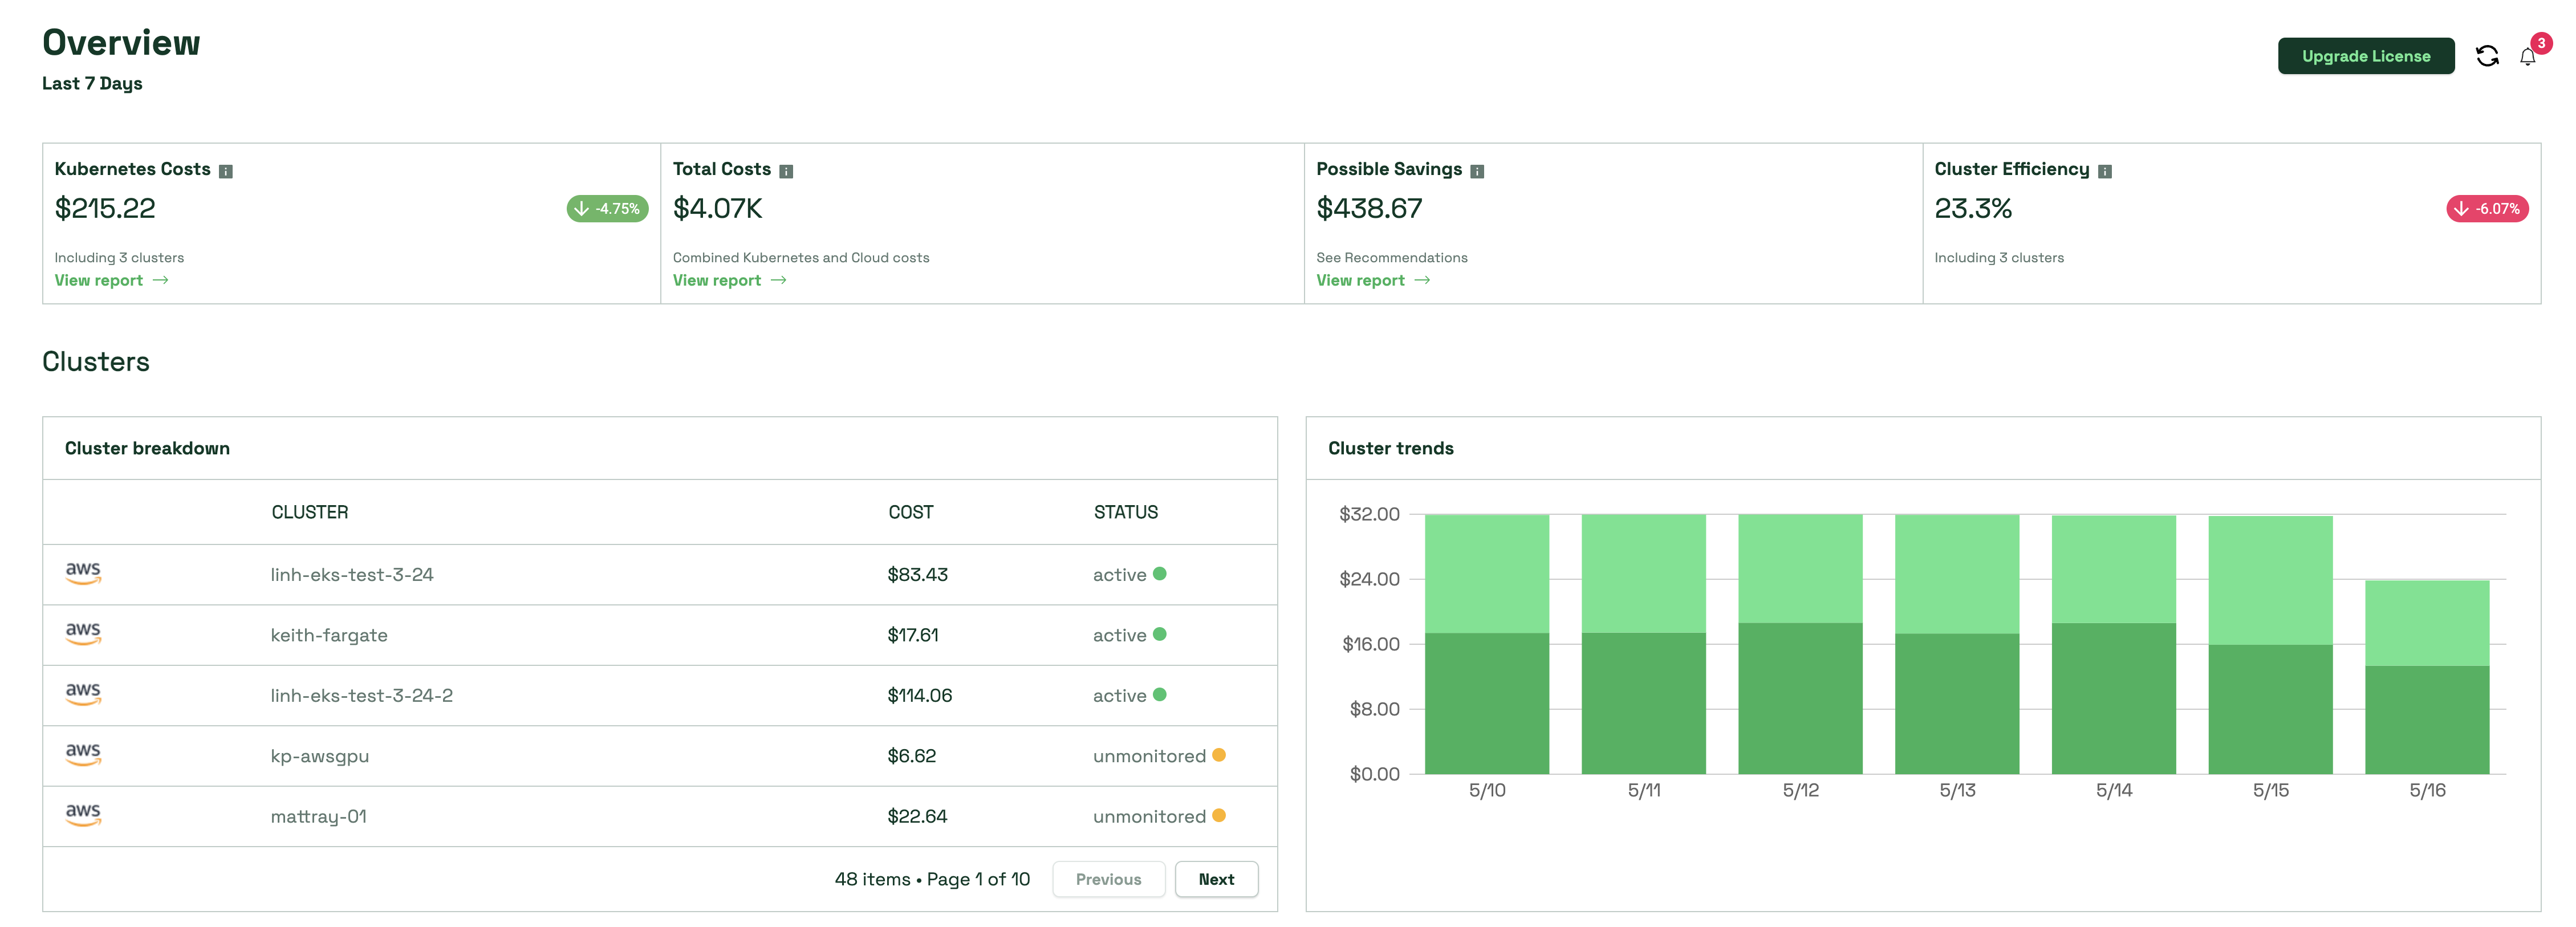
The main overview page shows high-level trends and a summary of what this instance of Kubecost is managing.
To understand which objects are consuming the most resources in monitored clusters, click Monitor then Allocations in the navigation tree on the left-hand side of the screen.
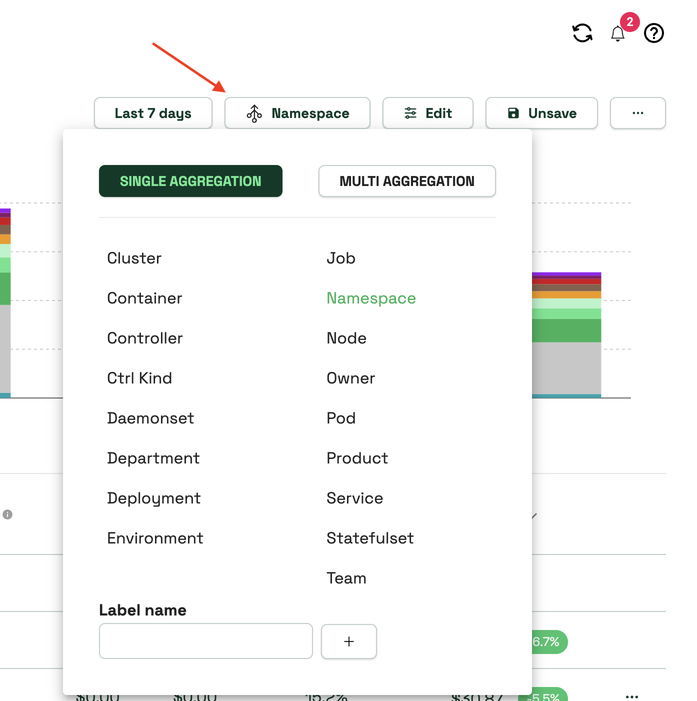
The Allocations page is where we drive the primary business objectives, chargeback and showback. We achieve this by several different aggregation methods over a given date range, giving flexibility to the user on how to display the data.
We aggregate the resources in a variety of ways the most common of which are:
- Kubernetes constructs: cluster, namespace, node, controllers, services, pod, label
- Logical constructs mapped to labels: Environment, Department, Owner, Team
- Date Range
- Filtering via namespaces, labels, service, nodes, pods, etc
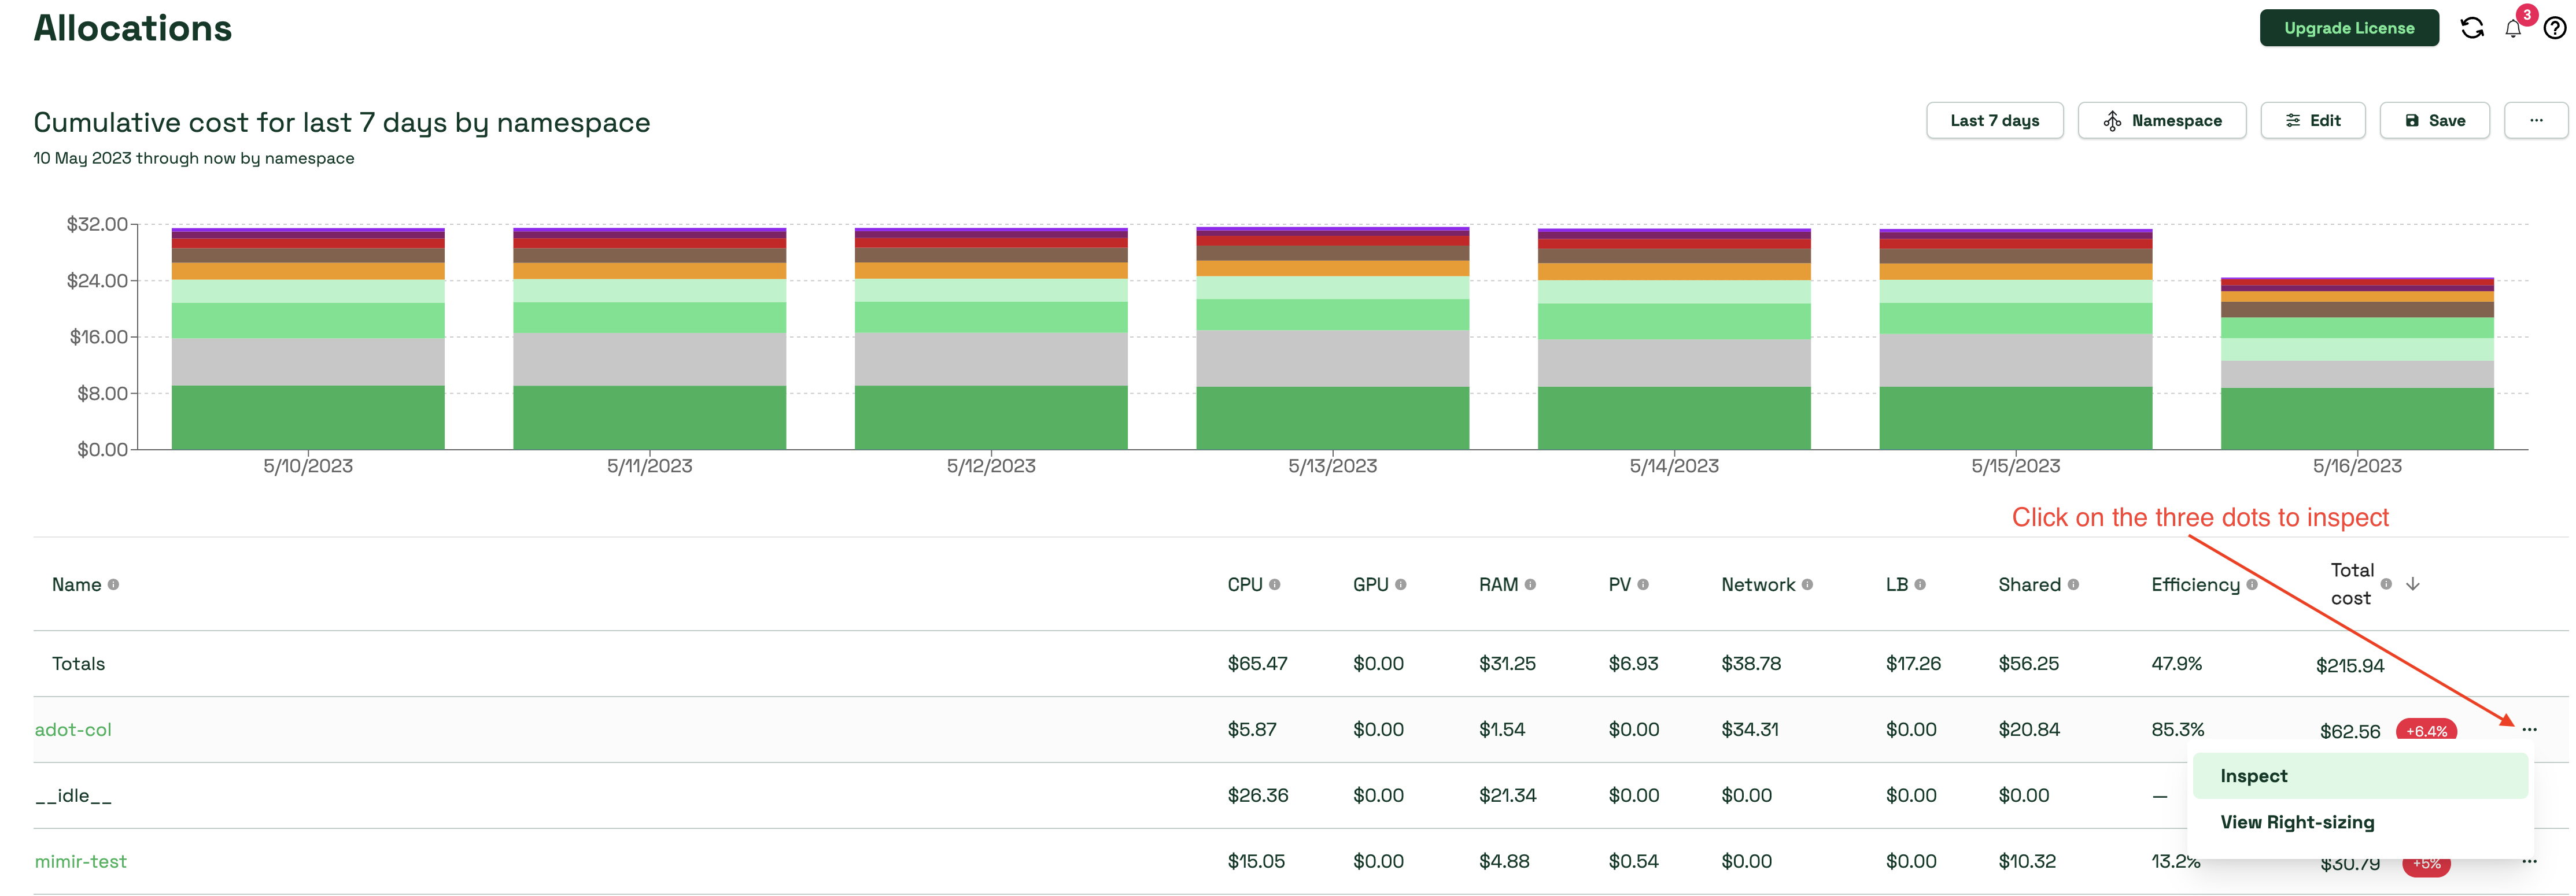
Before we start playing with the view, let’s define what is shown in the table on the Allocations page. Let’s aggregate by Namespace and take a look at the colum headers listed below:
- CPU: The total cost of CPU allocated to this object.
- GPU: The cost of GPUs requested by this object, as measured by resource limits.
- RAM: The total cost of memory allocated to this object, e.g. namespace or deployment.
- PV: The cost of persistent storage volumes claimed by this object.
- Network: The cost of network traffic based on internet egress, cross-zone egress, and other billed transfers. Note: these costs must be enabled.
- LB: The cost of cloud-service load balancers that have been allocated.
- Shared: The cost of shared resources allocated to this tenant. This field covers shared overhead, shared namespaces, and shared labels.
- Efficiency: The percentage of requested CPU and memory dollars utilized over the measured time window. Values range from 0 to above 100 percent.
- Total Cost: The Total Cost
Now that we have that out of the way, let’s dive into the different views available in the chart.
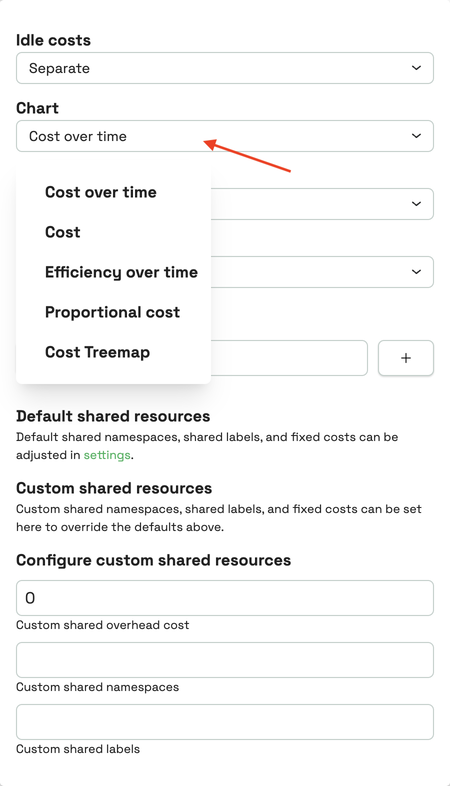
Click on the Edit button at the top of the Allocations page. This view can be customized based on given requirements. Some of the most useful settings are:
- Idle Costs: Idle costs are resources that are provisioned but not being fully used or requested by a tenant. Sharing by node will distribute this cost to the resources using that node. This is useful in a 100% chargeback model.
- Chart: Change the display based on cost over time, efficiency over time, and other options.
Within the UI, note that you can click the three dots on the far right of the row and select “Inspect” to open a detailed view of that resources, or click the row to drill into that resource. This gives you the ability to drill down to the container level of a given resource to view CPU, RAM, Efficiency, and Savings for a given resource. When you get to the container level, you can see where Kubecost starts making recommendations on breakdown on container resources that can lead to savings.